|
Global DEM: Analysis and Assessment
Interpolated SRTM V3 compared to US SRTM (N45W111)
|
After all DEM input data set were interpolated to the consistent
resolution of 1 arcsecond, overlapping regions were
mathematically analyzed and compared to determine the output
products quality. The interpolated SRTM V3 DEM overlaps with
the high resolution US SRTM in the United States. As shown on
the right, the two DEMs differ very little. As expected the US
SRTM is slightly more detailed compared to SRTM V3, which had
an original resolution of 3 arc seconds.
|
|
SRTM V3 Interpolated from 3 to 1 arc-second

|
|
US SRTM 1 arc-second

|
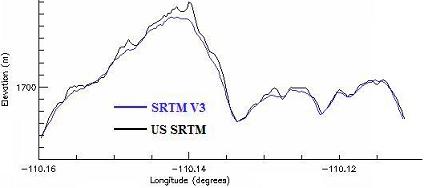
Interpolated SRTM V3 compared to US SRTM (N45W111)
Cross-Section at 45.6861 ° N
|
|
This profile plot shows elevation variations along a
cross-section of both DEMs. The plot demonstrates the
effectiveness of interpolation; the interpolated SRTM V3
closely matches the level of detail in US SRTM.
|
|
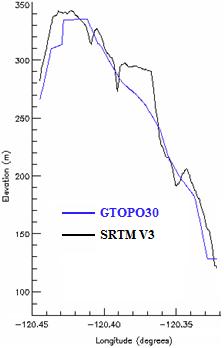
Interpolated GTOPO30 compared to Interpolated SRTM V3 (N45W121)
Cross-Section at 45.7222 ° N
|
|
GTOPO30 Interpolated from 30 to 1 arc-second

|
|
SRTM Interpolated from 3 to 1 arc-second

|
|
The relative lack of detail present in GTOPO30 is expected since
the input DEM was interpolated from 30 to 1 arcsecond. Compared
to SRTM V3, GTOPO30 is very coarse indicating that its
interpolation was only useful in establishing a consistent
global resolution of 1 arcsecond. Despite its relative low
quality, GTOPO30 serves as a useful supplementary DEM in regions
not covered by higher quality DEMs.
|
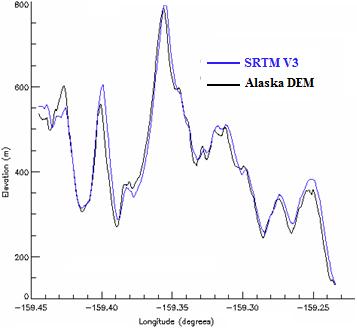
Interpolated Alaska DEM compared to SRTM V3 (N55W160)
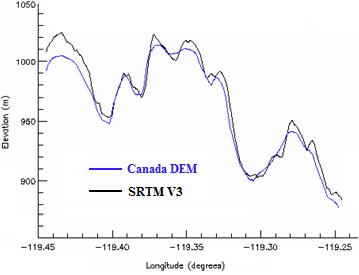
Interpolated Canada DEM compared to SRTM V3 (N56W120)
|